| Strategy
Performance Summary |
|
|
|
|
|
|
|
All Trades |
Long Trades |
Short Trades |
|
| Net Profit |
$21 289.25 |
$15 455.94 |
$5 833.31 |
|
| Gross Profit |
$179 579.64 |
$143 000.79 |
$36 578.85 |
|
| Gross Loss |
-$158 290.39 |
-$127 544.85 |
-$30 745.54 |
|
| Adjusted Net Profit |
$14 363.40 |
$8 912.36 |
$3 226.90 |
|
| Adjusted Gross Profit |
$175 504.59 |
$139 195.21 |
$34 989.97 |
|
| Adjusted Gross Loss |
-$161 141.20 |
-$130 282.85 |
-$31 763.07 |
|
| Select Net Profit |
-$10 615.17 |
-$10 363.39 |
-$ 251.78 |
|
| Select Gross Profit |
$102 575.54 |
$77 913.81 |
$24 661.73 |
|
| Select Gross Loss |
-$113 190.71 |
-$88 277.20 |
-$24 913.51 |
|
| Account Size Required |
$3 497.80 |
$4 308.57 |
$1 885.73 |
|
| Return on Account |
608.65% |
358.73% |
309.34% |
|
| Return on Initial Capital |
2128925.00% |
1545594.00% |
583331.00% |
|
| Max Strategy Drawdown |
-$3 710.30 |
-$4 413.33 |
-$2 017.06 |
|
| Max Strategy Drawdown (%) |
-432.25% |
-372.38% |
-15959.00% |
|
| Max Close To Close Drawdown |
-$3 497.80 |
-$4 308.57 |
-$1 885.73 |
|
| Max Close To Close Drawdown
(%) |
-836.64% |
-708.51% |
-35865.00% |
|
| Return on Max Strategy
Drawdown |
5.737878339 |
3.502103854 |
2.891986356 |
|
| Profit Factor |
1.134494899 |
1.121180432 |
1.189728657 |
|
| Adjusted Profit Factor |
1.089135477 |
1.06840778 |
1.101592747 |
|
| Select Profit Factor |
-0.906218717 |
-0.882604002 |
-0.989893837 |
|
| Max # Contracts Held |
1 |
1 |
1 |
|
| Slippage Paid |
$ 0.00 |
$ 0.00 |
$ 0.00 |
|
| Commission Paid |
$12 964.50 |
$9 241.56 |
$3 722.94 |
|
| Open Position P/L |
n/a |
n/a |
n/a |
|
| Annual Rate of Return |
74818.76% |
54318.23% |
20500.54% |
|
| Monthly Rate of Return |
6234.90% |
4526.52% |
1708.38% |
|
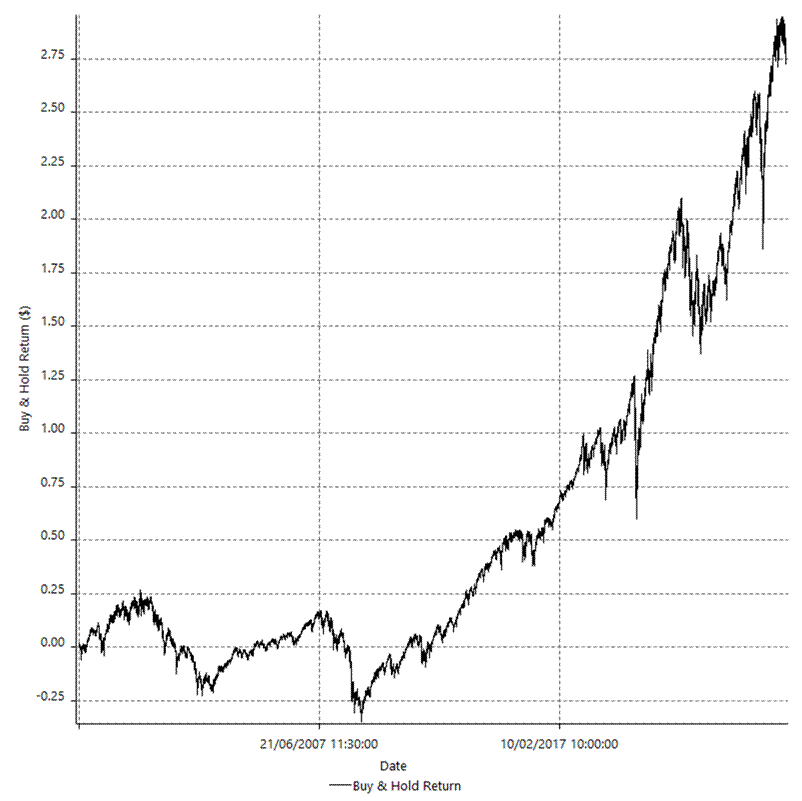
| Buy & Hold Return |
$ 2.77 |
$ 2.77 |
$ 2.75 |
|
| Avg Monthly Return |
$ 62.25 |
$ 62.25 |
$ 62.25 |
|
| Monthly Return StdDev |
$ 404.11 |
$ 404.11 |
$ 404.11 |
|
| Total # of Trades |
5025 |
3582 |
1443 |
|
| % Profitable |
38.65% |
39.42% |
36.73% |
|
|
| Performance Ratios |
|
|
| Upside Potential Ratio |
-0.000277376 |
|
| Sharpe Ratio |
-0.053477517 |
|
| Annualized Sharpe Ratio |
-0.185251552 |
|
| Sortino Ratio |
-0.03472629 |
|
| Fouse Ratio |
-1619.559676 |
|
| Calmar Ratio |
0.006754262 |
|
| Sterling Ratio |
8.91792E-05 |
|
| RINA Index |
-328.5620549 |
|
| Net Profit as % of Largest
loss |
1759.33% |
|
| Net Profit as % of Max Trade
Drawdown |
1617.37% |
|
| Net Profit as % of Max
Strategy Drawdown |
573.79% |
|
| Select Net Profit as % of
Largest loss |
-877.23% |
|
| Select Net Profit as % of Max
Trade Drawdown |
-806.45% |
|
| Select Net Profit as % of Max
Strategy Drawdown |
-286.10% |
|
| Adj Net Profit as % of Largest
loss |
1186.98% |
|
| Adj Net Profit as % of Max
Trade Drawdown |
1091.20% |
|
| Adj Net Profit as % of Max
Strategy Drawdown |
387.12% |
|
|
| Time Analysis |
|
|
| Trading Period |
28 Yrs, 6 Mths, 13 Dys, 23 Hrs, 30
Mins |
|
| Time in the Market |
19 Yrs, 4 Mths, 22 Dys, 13 Hrs, 50
Mins |
|
| Percent in the Market |
67.96% |
|
| Longest flat period |
7 Dys, 23 Hrs, 10 Mins |
|
| Max Run-up Date |
07/04/2020 |
|
| Max Drawdown Date |
07/04/2025 |
|
| Max Strategy Drawdown Date |
19/11/2025 13:40 |
|
| Max Close To Close Drawdown
Date |
19/11/2025 13:40 |
|
|
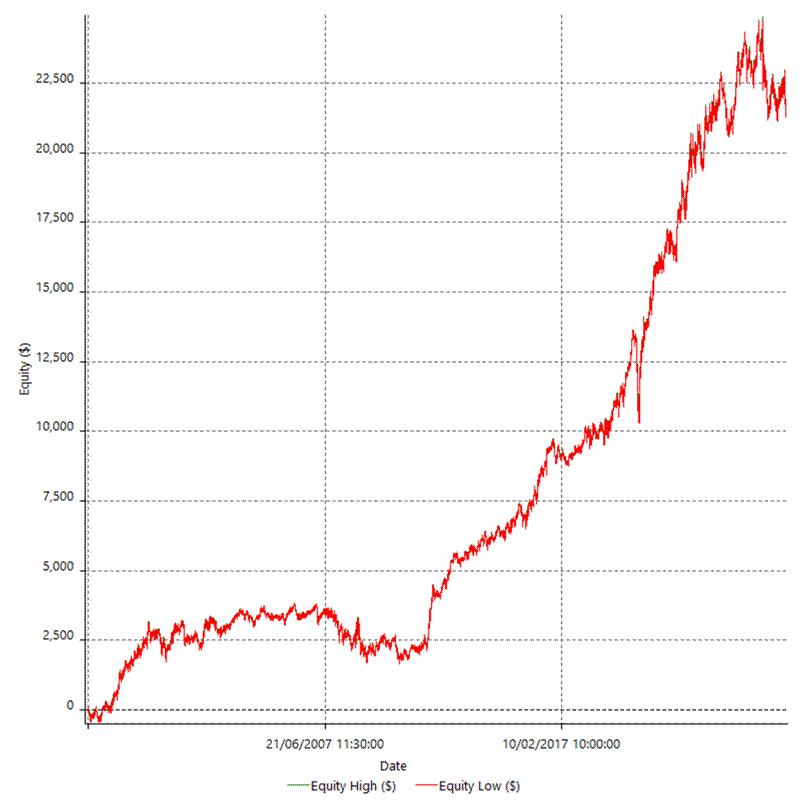
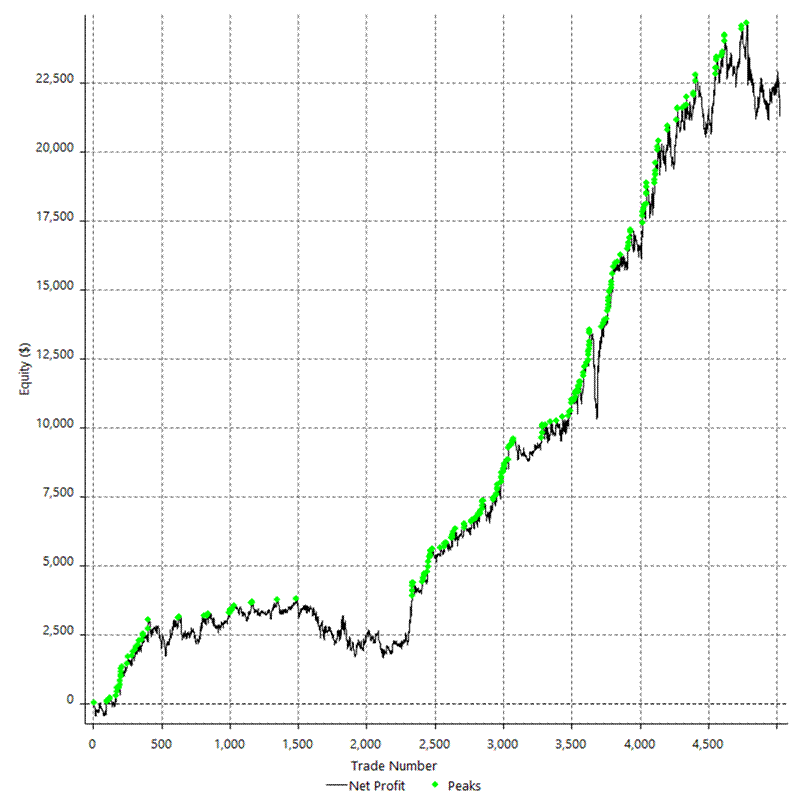
| Equity Curve Detailed |
|
|
|
|
|
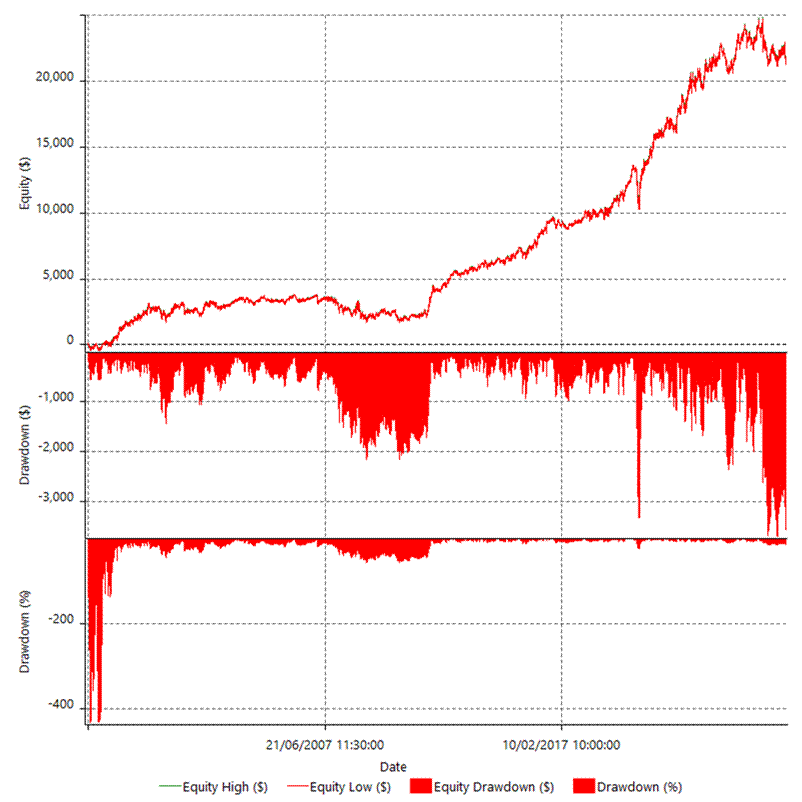
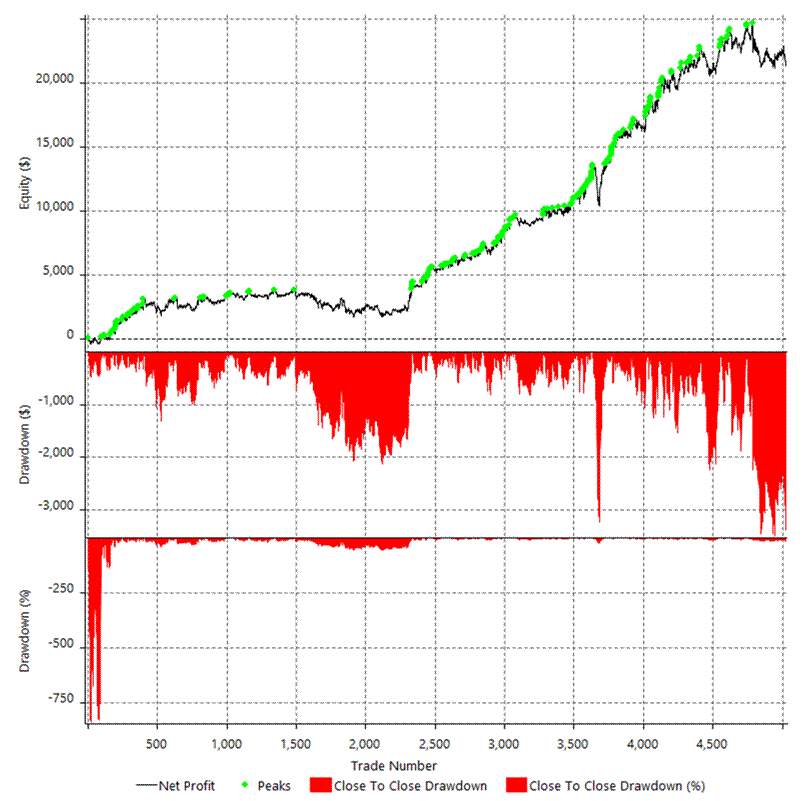
| Equity
Curve Detailed with DrawDown |
|
|
|
|
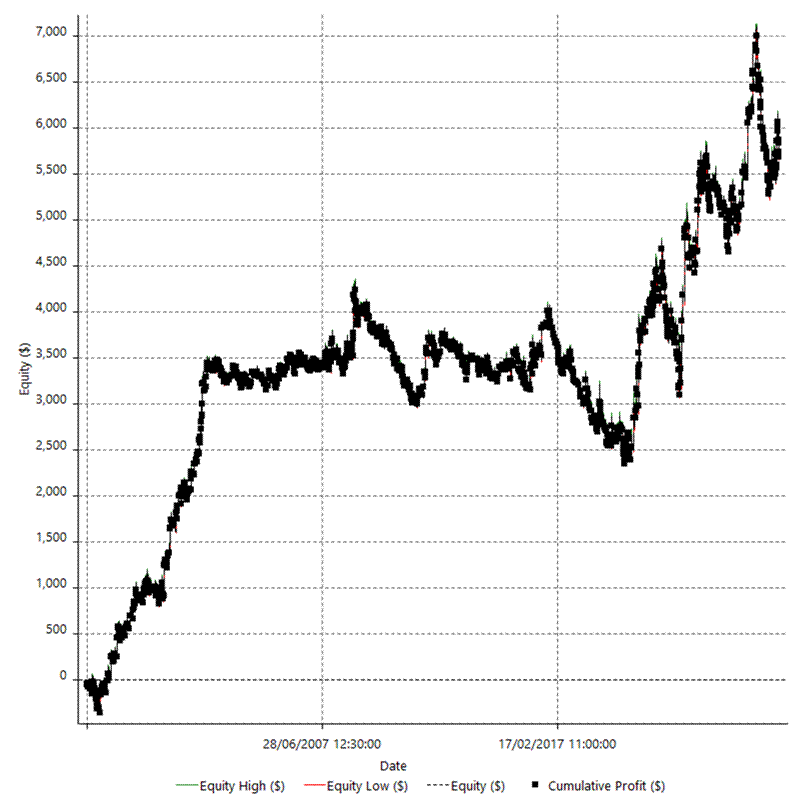
| Equity Curve Detailed Long |
|
|
|
|
| Equity Curve Detailed Short |
|
|
|
|
|
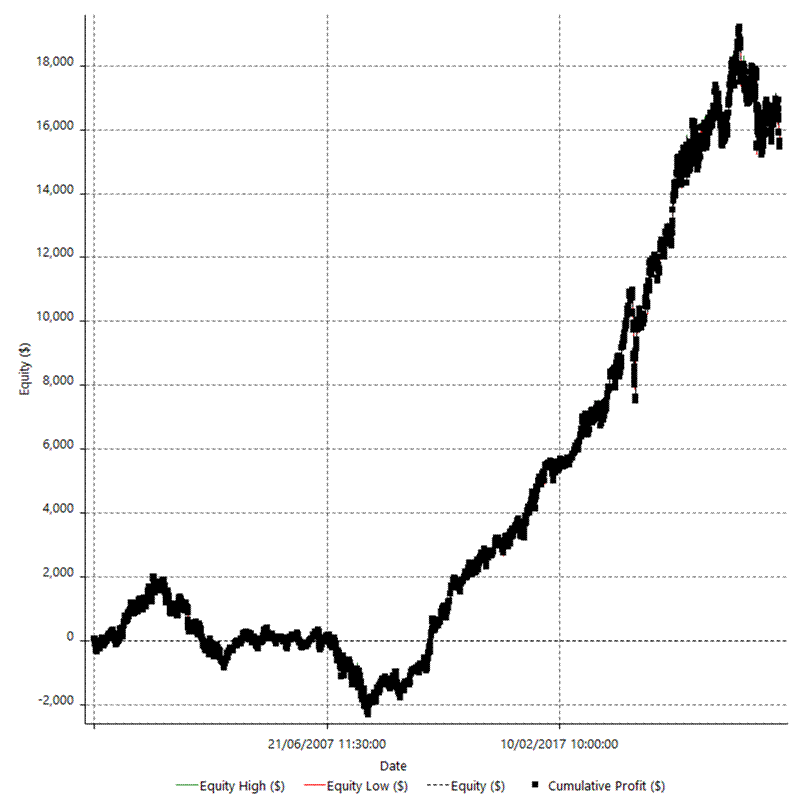
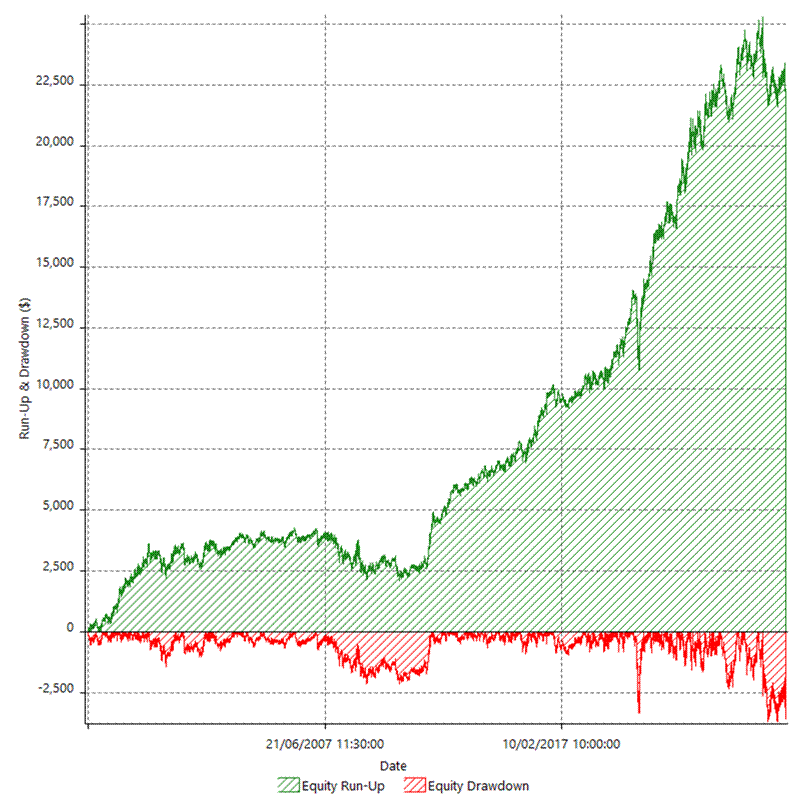
| Equity Run-up & Drawdown |
|
|
|
|
|
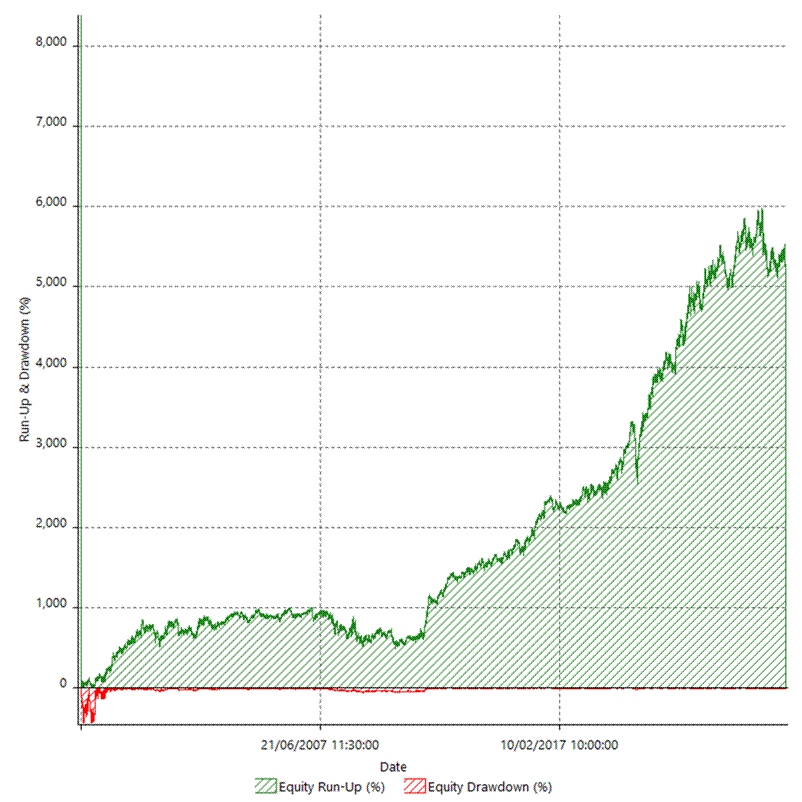
| Equity Run-up & Drawdown
(%) |
|
|
|
|
| Equity Curve Close To Close |
|
|
|
|
| Equity
Curve Close To Close With Drawdown |
|
|
|
|
|
| Buy & Hold Return |
|
|
|
|
|
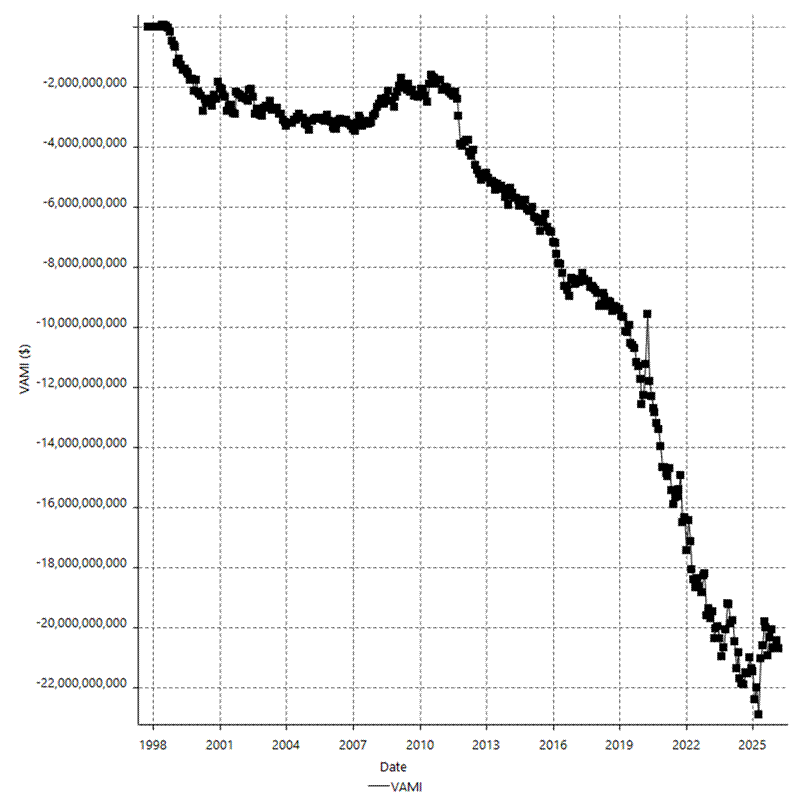
| Value Added Monthly Index |
|
|
|
|
|
|
|
|
|
|