| Strategy
Performance Summary |
|
|
|
|
|
|
|
All Trades |
Long Trades |
Short Trades |
|
| Net Profit |
$341 080.38 |
$258 062.76 |
$83 017.62 |
|
| Gross Profit |
$1834 583.96 |
$1455 956.80 |
$378 627.16 |
|
| Gross Loss |
-$1493 503.58 |
-$1197 894.04 |
-$295 609.54 |
|
| Adjusted Net Profit |
$273 272.39 |
$194 090.61 |
$57 283.59 |
|
| Adjusted Gross Profit |
$1794 231.75 |
$1418 174.77 |
$362 932.56 |
|
| Adjusted Gross Loss |
-$1520 959.36 |
-$1224 084.16 |
-$305 648.97 |
|
| Select Net Profit |
-$2 802.50 |
-$21 232.54 |
$18 430.04 |
|
| Select Gross Profit |
$1030 951.46 |
$784 851.26 |
$246 100.20 |
|
| Select Gross Loss |
-$1033 753.96 |
-$806 083.80 |
-$227 670.16 |
|
| Account Size Required |
$31 293.50 |
$34 177.86 |
$14 935.54 |
|
| Return on Account |
1089.94% |
755.06% |
555.84% |
|
| Return on Initial Capital |
34108038.00% |
25806276.00% |
8301762.00% |
|
| Max Strategy Drawdown |
-$32 272.62 |
-$35 181.98 |
-$16 763.54 |
|
| Max Strategy Drawdown (%) |
-407.80% |
-353.53% |
-136826.00% |
|
| Max Close To Close Drawdown |
-$31 293.50 |
-$34 177.86 |
-$14 935.54 |
|
| Max Close To Close Drawdown
(%) |
-759.09% |
-638.17% |
-131620.00% |
|
| Return on Max Strategy
Drawdown |
10.56872296 |
7.335083472 |
4.952272611 |
|
| Profit Factor |
1.228376004 |
1.215430373 |
1.280835388 |
|
| Adjusted Profit Factor |
1.179671065 |
1.158559855 |
1.187416282 |
|
| Select Profit Factor |
-0.997289007 |
-0.973659637 |
1.080950617 |
|
| Max # Contracts Held |
1 |
1 |
1 |
|
| Slippage Paid |
$ 0.00 |
$ 0.00 |
$ 0.00 |
|
| Commission Paid |
$20 707.12 |
$14 737.24 |
$5 969.88 |
|
| Open Position P/L |
n/a |
n/a |
n/a |
|
| Annual Rate of Return |
1188159.23% |
898965.95% |
289193.27% |
|
| Monthly Rate of Return |
99013.27% |
74913.83% |
24099.44% |
|
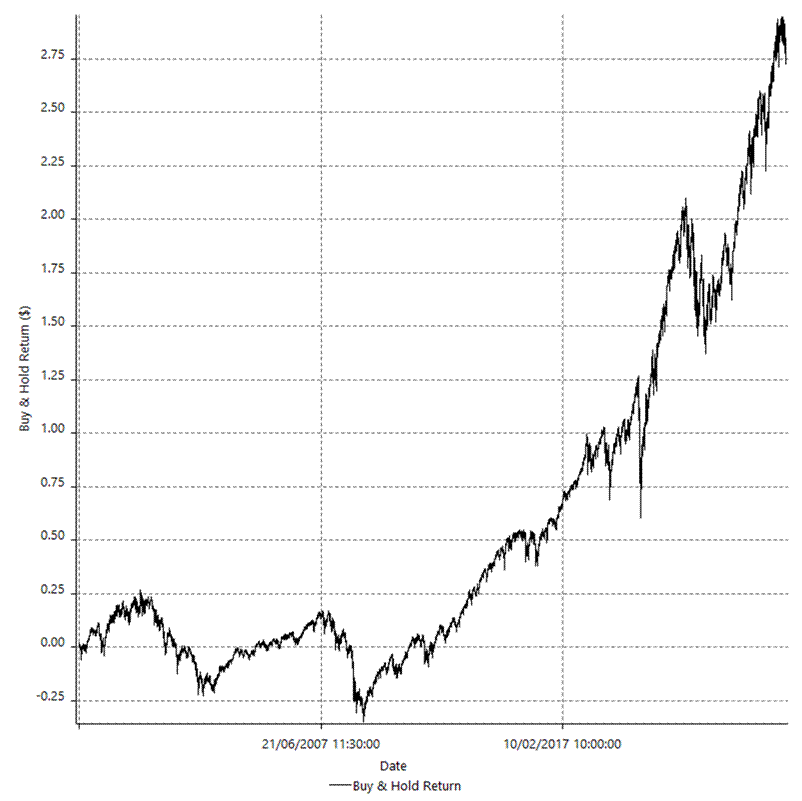
| Buy & Hold Return |
$ 3.09 |
$ 3.09 |
$ 3.06 |
|
| Avg Monthly Return |
$ 988.64 |
$ 988.64 |
$ 988.64 |
|
| Monthly Return StdDev |
$3 922.95 |
$3 922.95 |
$3 922.95 |
|
| Total # of Trades |
5026 |
3577 |
1449 |
|
| % Profitable |
41.13% |
41.52% |
40.17% |
|
|
| Performance Ratios |
|
|
| Upside Potential Ratio |
-2.99211E-06 |
|
| Sharpe Ratio |
-0.053558496 |
|
| Annualized Sharpe Ratio |
-0.185532071 |
|
| Sortino Ratio |
-0.033256161 |
|
| Fouse Ratio |
-135540.1724 |
|
| Calmar Ratio |
0.01851886 |
|
| Sterling Ratio |
9.8106E-06 |
|
| RINA Index |
-9.036707471 |
|
| Net Profit as % of Largest
loss |
3598.23% |
|
| Net Profit as % of Max Trade
Drawdown |
2669.47% |
|
| Net Profit as % of Max
Strategy Drawdown |
1056.87% |
|
| Select Net Profit as % of
Largest loss |
-29.56% |
|
| Select Net Profit as % of Max
Trade Drawdown |
-21.93% |
|
| Select Net Profit as % of Max
Strategy Drawdown |
-8.68% |
|
| Adj Net Profit as % of Largest
loss |
2882.89% |
|
| Adj Net Profit as % of Max
Trade Drawdown |
2138.77% |
|
| Adj Net Profit as % of Max
Strategy Drawdown |
846.76% |
|
|
| Time Analysis |
|
|
| Trading Period |
28 Yrs, 9 Mths, 16 Dys, 2 Hrs, 15
Mins |
|
| Time in the Market |
19 Yrs, 5 Mths, 2 Dys, 16 Hrs, 10
Mins |
|
| Percent in the Market |
67.45% |
|
| Longest flat period |
2 Mths, 10 Dys, 3 Hrs, 50 Mins |
|
| Max Run-up Date |
07/04/2020 |
|
| Max Drawdown Date |
09/03/2020 |
|
| Max Strategy Drawdown Date |
02/04/2020 09:30 |
|
| Max Close To Close Drawdown
Date |
31/03/2020 11:40 |
|
|
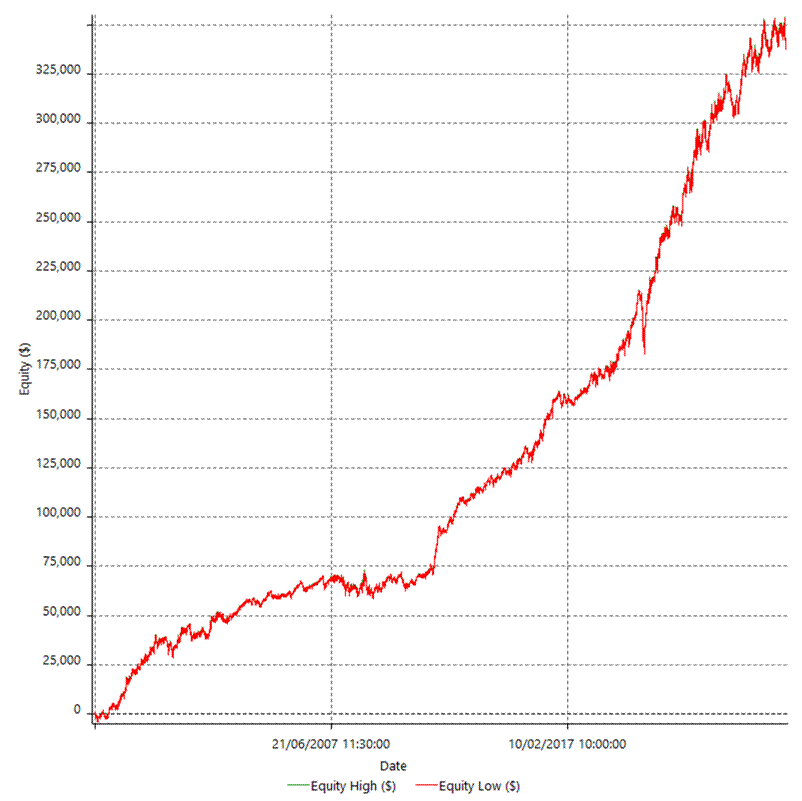
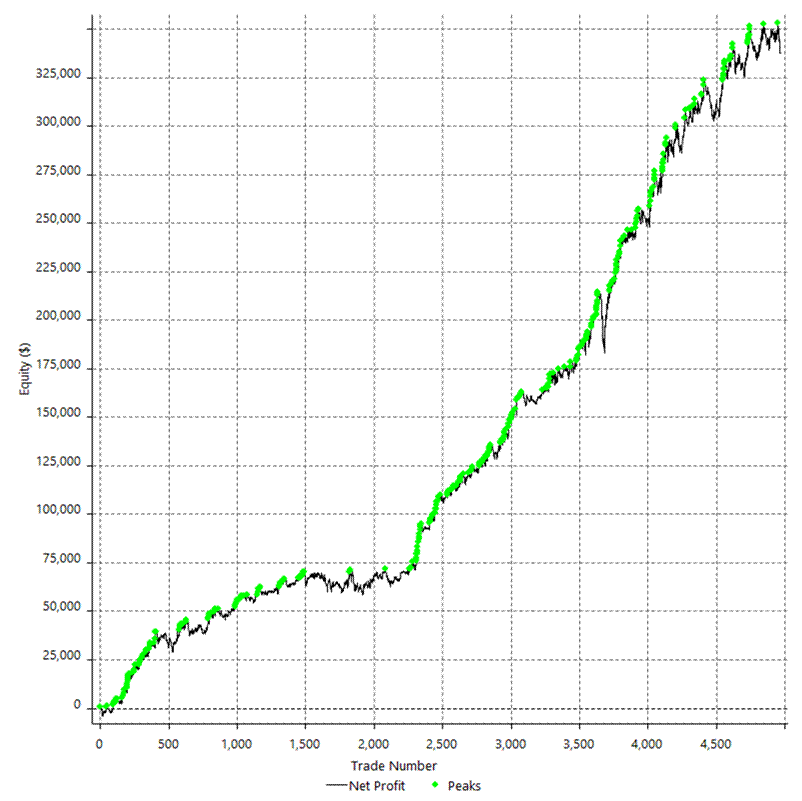
| Equity Curve Detailed |
|
|
|
|
|
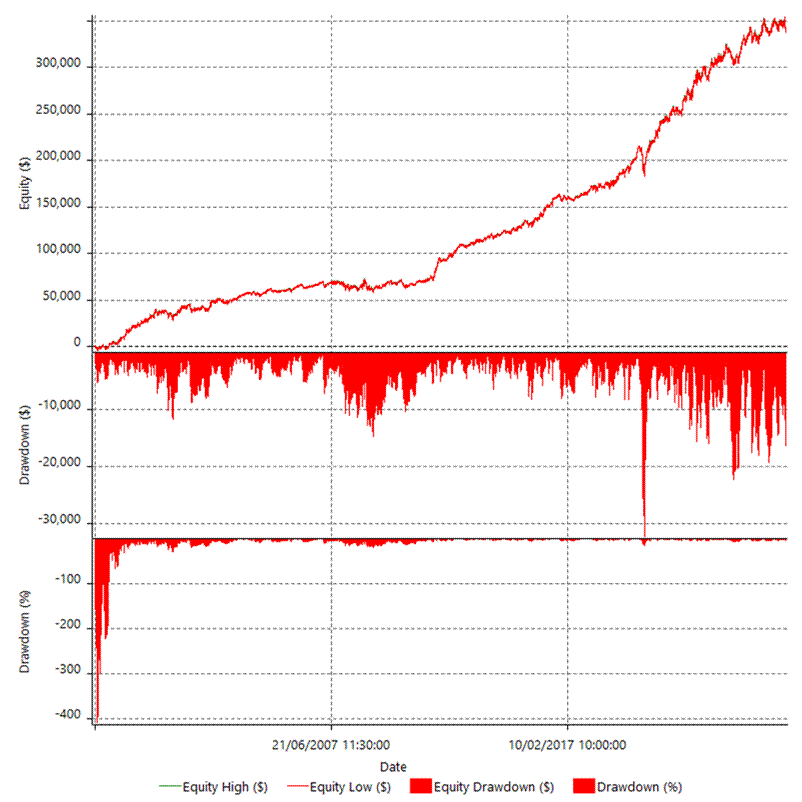
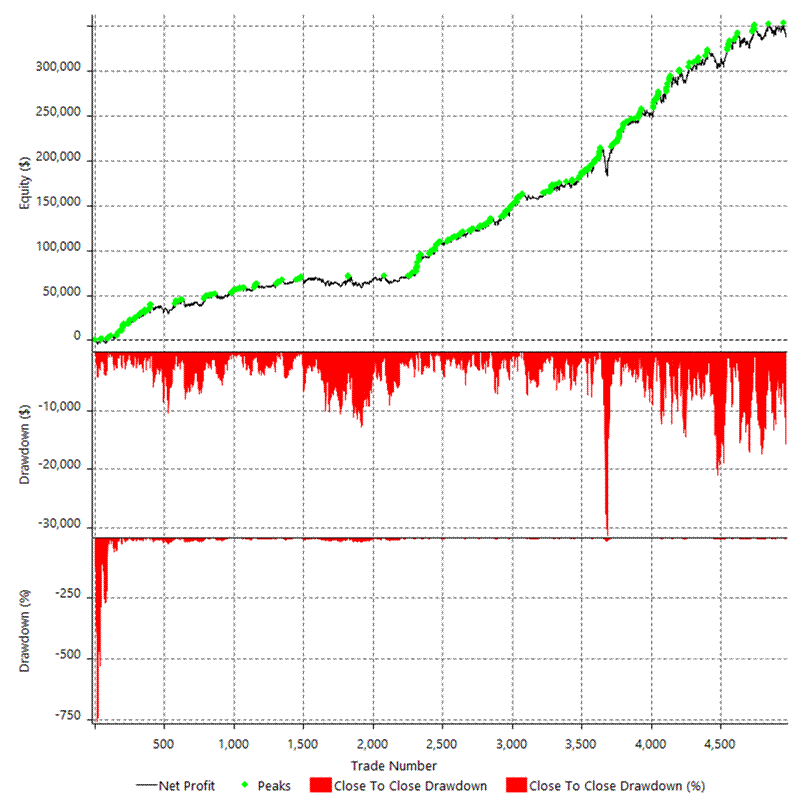
| Equity
Curve Detailed with DrawDown |
|
|
|
|
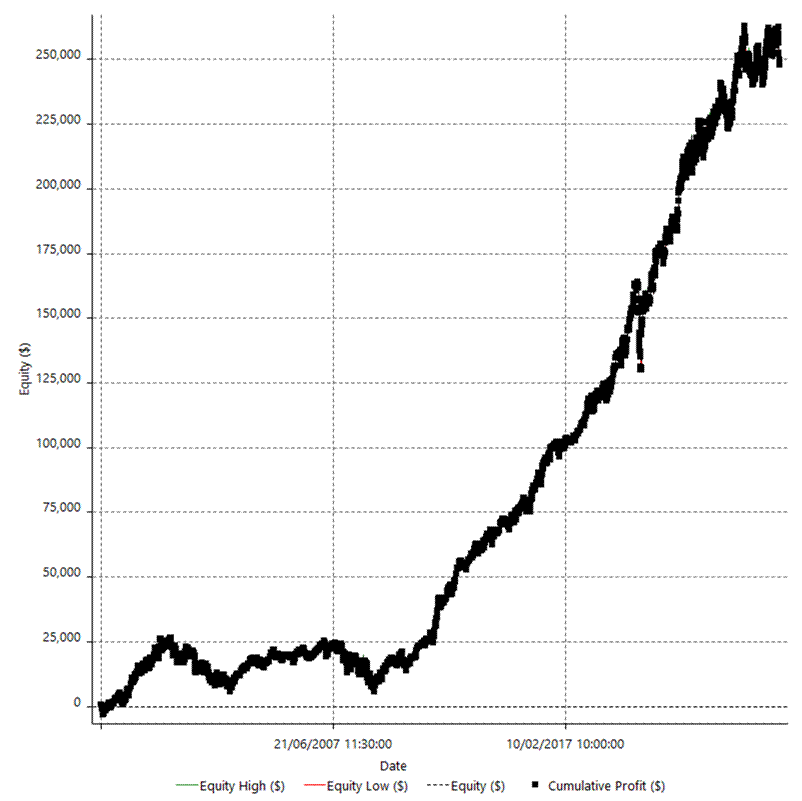
| Equity Curve Detailed Long |
|
|
|
|
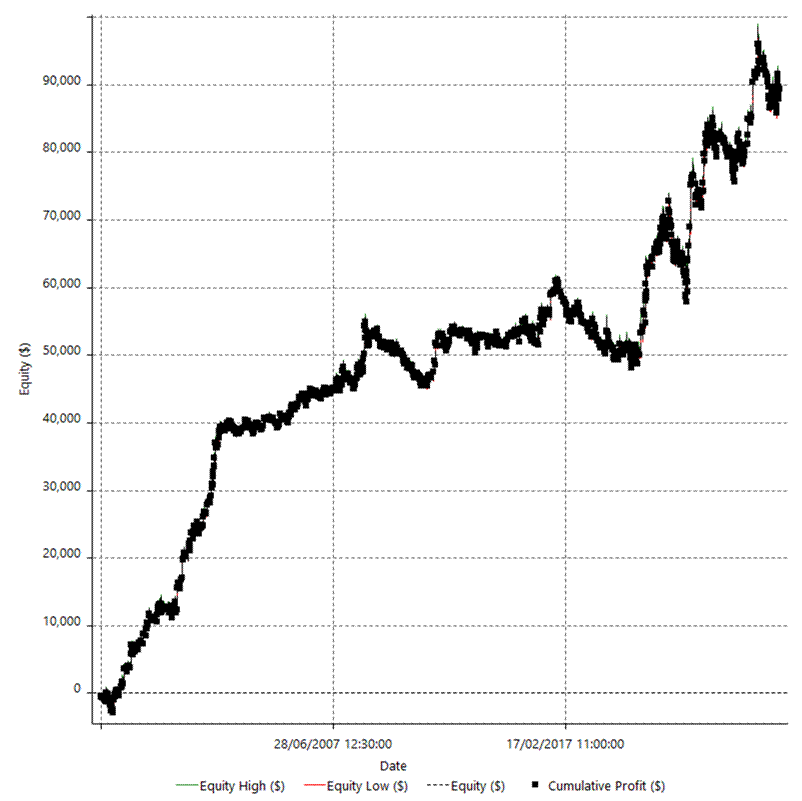
| Equity Curve Detailed Short |
|
|
|
|
|
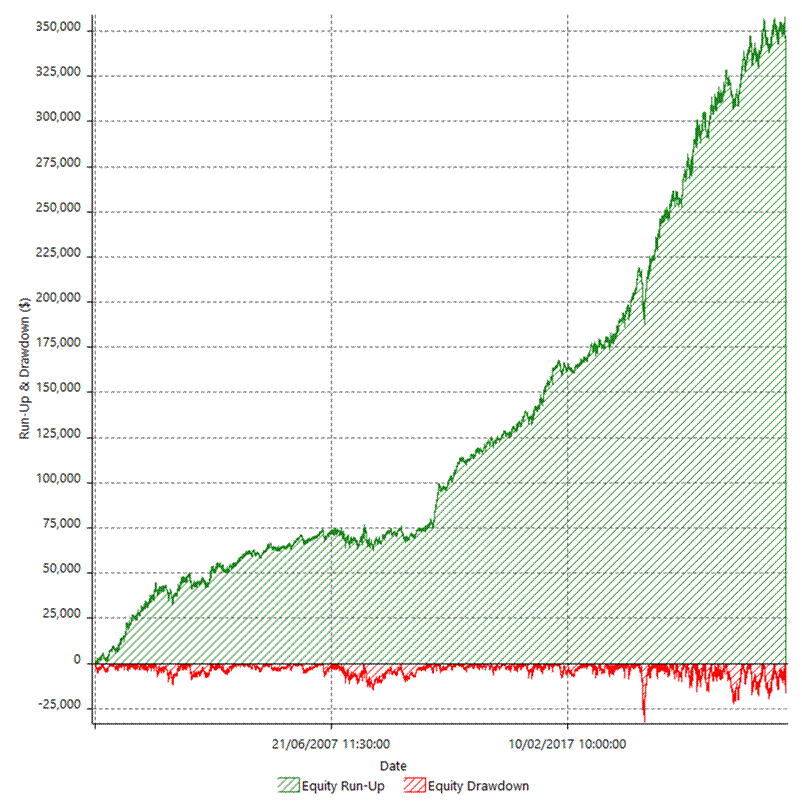
| Equity Run-up & Drawdown |
|
|
|
|
|
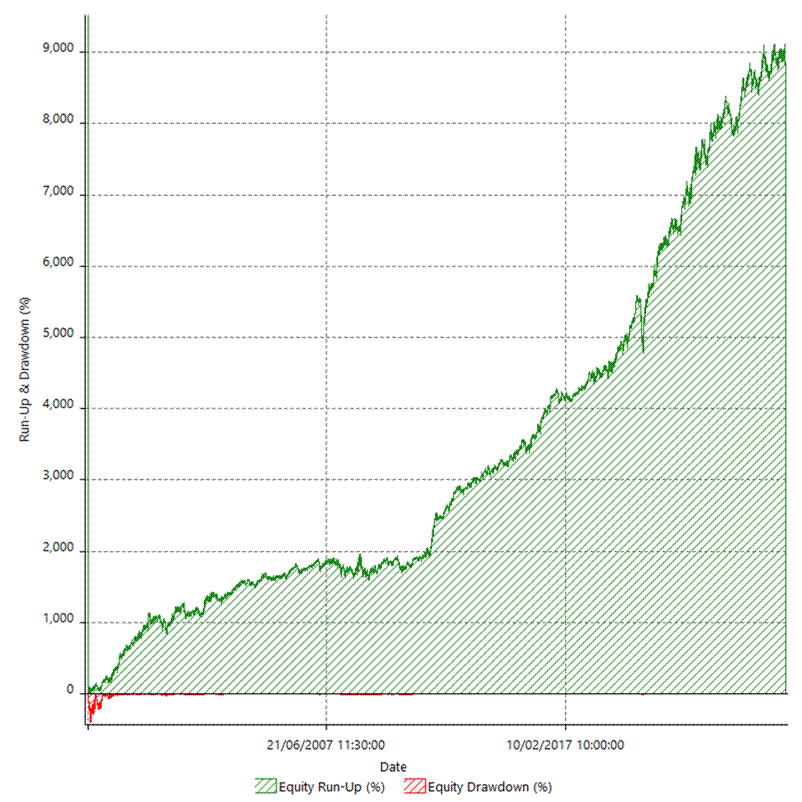
| Equity Run-up & Drawdown
(%) |
|
|
|
|
| Equity Curve Close To Close |
|
|
|
|
| Equity
Curve Close To Close With Drawdown |
|
|
|
|
|
| Buy & Hold Return |
|
|
|
|
|
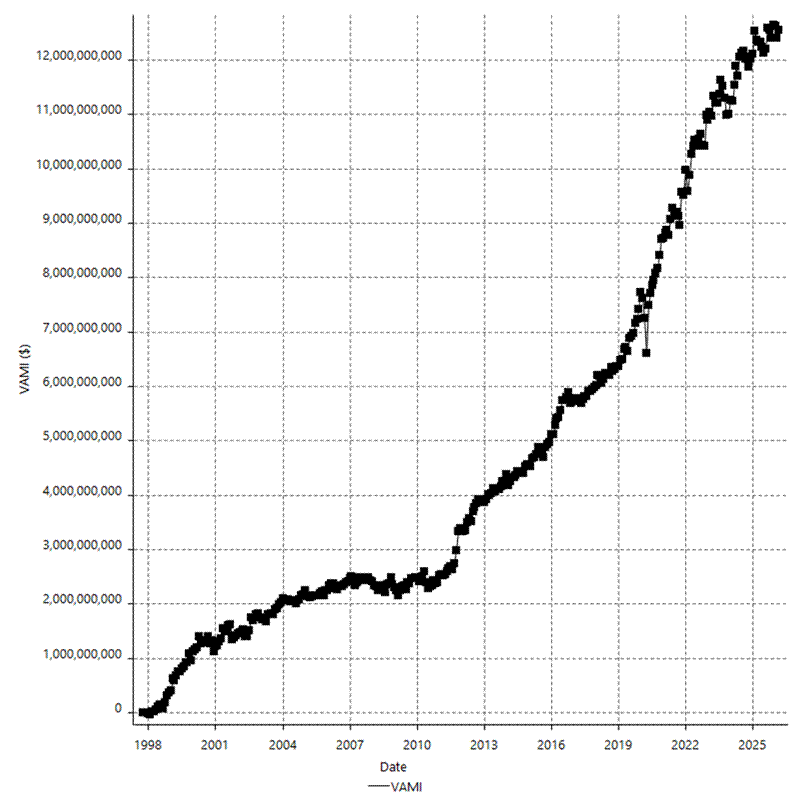
| Value Added Monthly Index |
|
|
|
|
|
|
|
|
|
|