| Strategy
Performance Summary |
|
|
|
|
|
|
|
All Trades |
Long Trades |
Short Trades |
|
| Net Profit |
$304 940.22 |
$279 790.92 |
$25 149.30 |
|
| Gross Profit |
$1565 800.68 |
$948 099.16 |
$617 701.52 |
|
| Gross Loss |
-$1260 860.46 |
-$668 308.24 |
-$592 552.22 |
|
| Adjusted Net Profit |
$223 521.83 |
$214 619.10 |
-$24 625.12 |
|
| Adjusted Gross Profit |
$1518 286.68 |
$909 617.00 |
$589 478.02 |
|
| Adjusted Gross Loss |
-$1294 764.85 |
-$694 997.90 |
-$614 103.14 |
|
| Select Net Profit |
$219 566.94 |
$219 375.82 |
$ 191.12 |
|
| Select Gross Profit |
$930 825.32 |
$549 946.22 |
$380 879.10 |
|
| Select Gross Loss |
-$711 258.38 |
-$330 570.40 |
-$380 687.98 |
|
| Account Size Required |
$60 697.34 |
$32 141.34 |
$54 314.02 |
|
| Return on Account |
502.39% |
870.50% |
46.30% |
|
| Return on Initial Capital |
30494022.00% |
27979092.00% |
2514930.00% |
|
| Max Strategy Drawdown |
-$74 266.82 |
-$38 478.84 |
-$59 902.78 |
|
| Max Strategy Drawdown (%) |
-2013.20% |
-2621.23% |
-857.57% |
|
| Max Close To Close Drawdown |
-$60 697.34 |
-$32 141.34 |
-$54 314.02 |
|
| Max Close To Close Drawdown
(%) |
-4567.47% |
-256236.00% |
-1373.43% |
|
| Return on Max Strategy
Drawdown |
4.106008848 |
7.271293002 |
0.419835273 |
|
| Profit Factor |
1.241850886 |
1.418655499 |
1.042442335 |
|
| Adjusted Profit Factor |
1.17263508 |
1.308805396 |
-0.959900679 |
|
| Select Profit Factor |
1.308702078 |
1.663628141 |
1.000502038 |
|
| Max # Contracts Held |
1 |
1 |
1 |
|
| Slippage Paid |
$61 737.50 |
$30 862.50 |
$30 875.00 |
|
| Commission Paid |
$10 174.34 |
$5 086.14 |
$5 088.20 |
|
| Open Position P/L |
-$7 327.06 |
-$7 327.06 |
n/a |
|
| Annual Rate of Return |
1071886.37% |
983484.81% |
88401.56% |
|
| Monthly Rate of Return |
89323.86% |
81957.07% |
7366.80% |
|
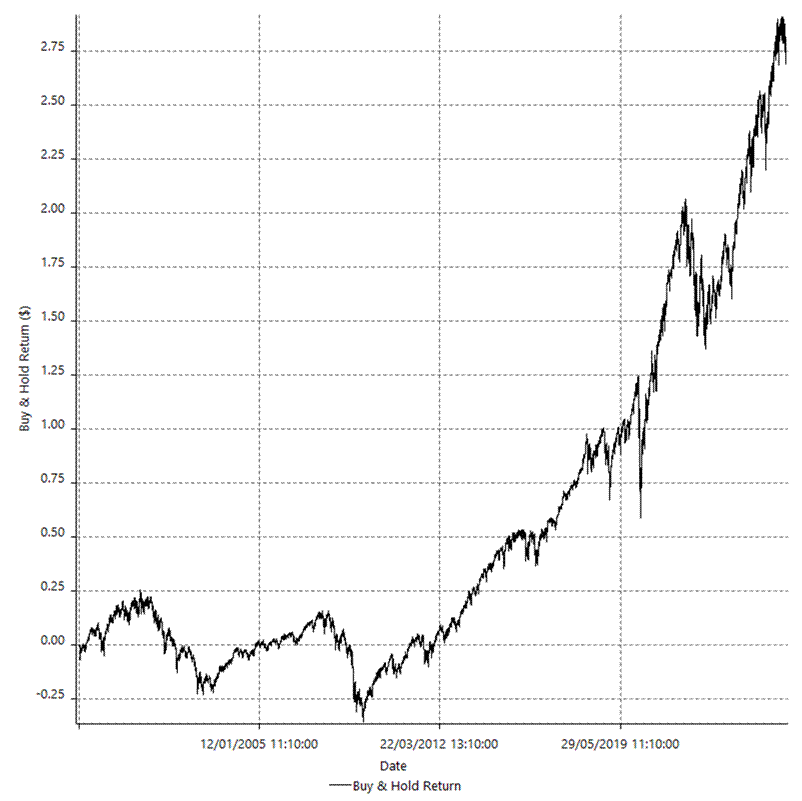
| Buy & Hold Return |
$ 2.73 |
$ 2.74 |
$ 2.73 |
|
| Avg Monthly Return |
$ 870.21 |
$ 870.21 |
$ 870.21 |
|
| Monthly Return StdDev |
$5 534.54 |
$5 534.54 |
$5 534.54 |
|
| Total # of Trades |
2469 |
1234 |
1235 |
|
| % Profitable |
43.99% |
49.19% |
38.79% |
|
|
| Performance Ratios |
|
|
| Upside Potential Ratio |
-2.63225E-06 |
|
| Sharpe Ratio |
-0.053723093 |
|
| Annualized Sharpe Ratio |
-0.186102252 |
|
| Sortino Ratio |
-0.036053055 |
|
| Fouse Ratio |
-309363.4338 |
|
| Calmar Ratio |
0.016842388 |
|
| Sterling Ratio |
6.22578E-06 |
|
| RINA Index |
216.7840348 |
|
| Net Profit as % of Largest
loss |
2429.01% |
|
| Net Profit as % of Max Trade
Drawdown |
1818.96% |
|
| Net Profit as % of Max
Strategy Drawdown |
410.60% |
|
| Select Net Profit as % of
Largest loss |
1748.96% |
|
| Select Net Profit as % of Max
Trade Drawdown |
1309.71% |
|
| Select Net Profit as % of Max
Strategy Drawdown |
295.65% |
|
| Adj Net Profit as % of Largest
loss |
1780.47% |
|
| Adj Net Profit as % of Max
Trade Drawdown |
1333.30% |
|
| Adj Net Profit as % of Max
Strategy Drawdown |
300.97% |
|
|
| Time Analysis |
|
|
| Trading Period |
28 Yrs, 6 Mths, 11 Dys, 23 Hrs, 20
Mins |
|
| Time in the Market |
28 Yrs, 6 Mths, 6 Dys, 22 Hrs |
|
| Percent in the Market |
99.95% |
|
| Longest flat period |
n/a |
|
| Max Run-up Date |
28/02/2020 |
|
| Max Drawdown Date |
20/05/2022 |
|
| Max Strategy Drawdown Date |
13/03/2026 15:10 |
|
| Max Close To Close Drawdown
Date |
17/10/2025 11:50 |
|
|
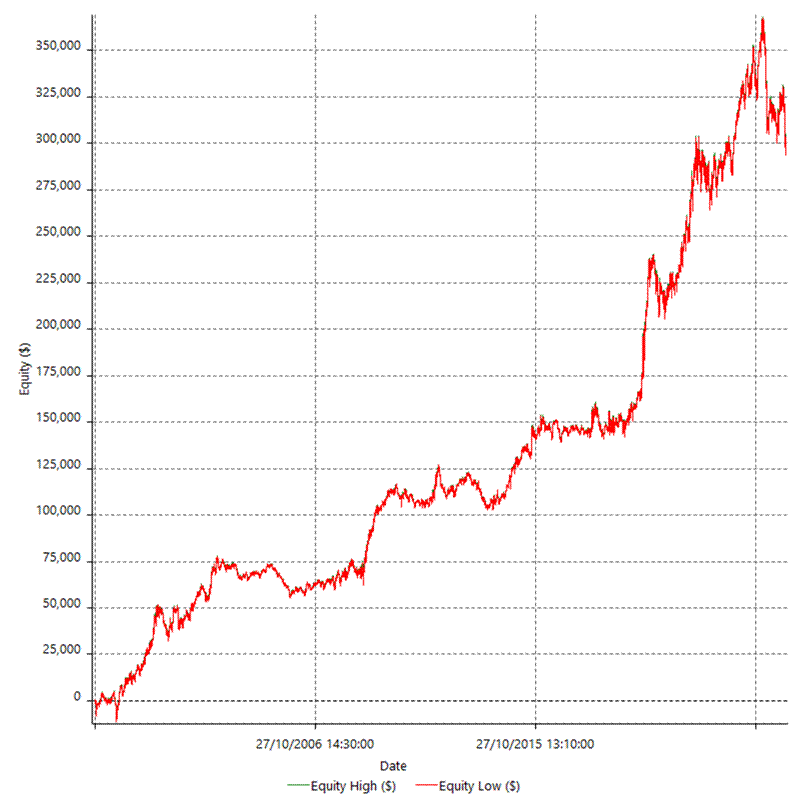
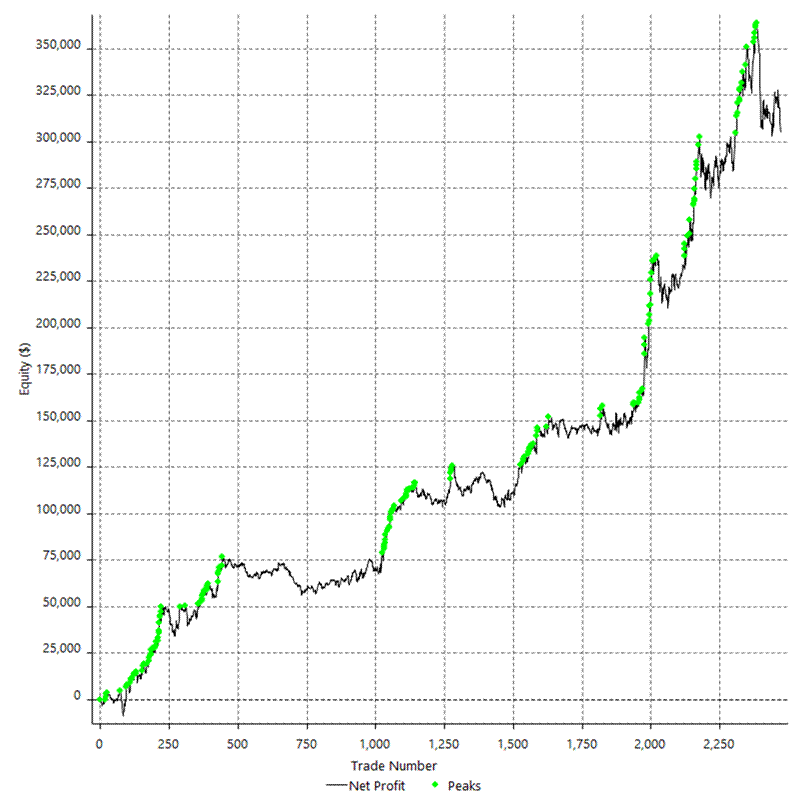
| Equity Curve Detailed |
|
|
|
|
|
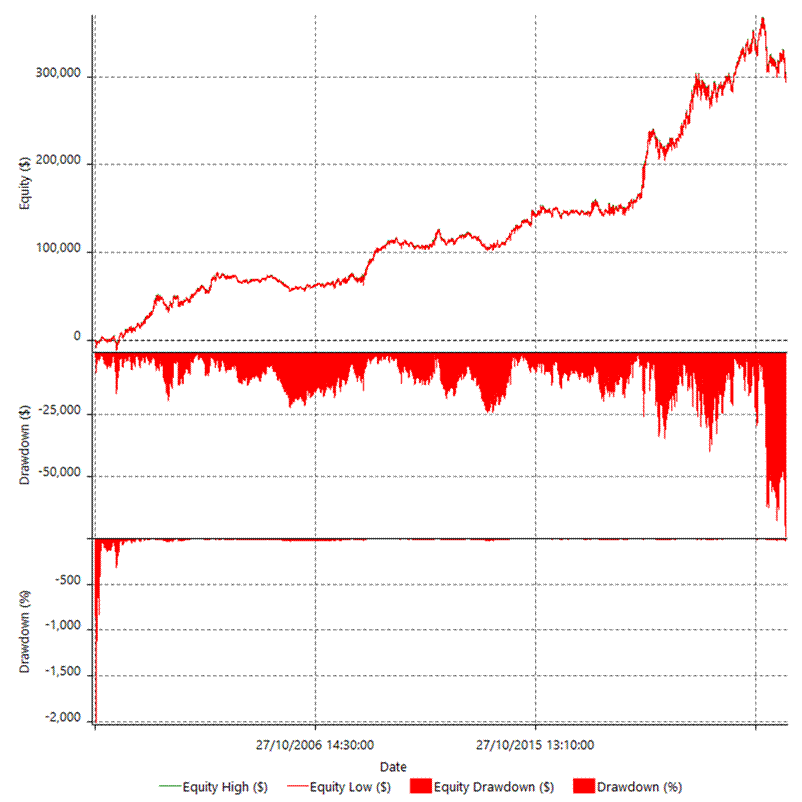
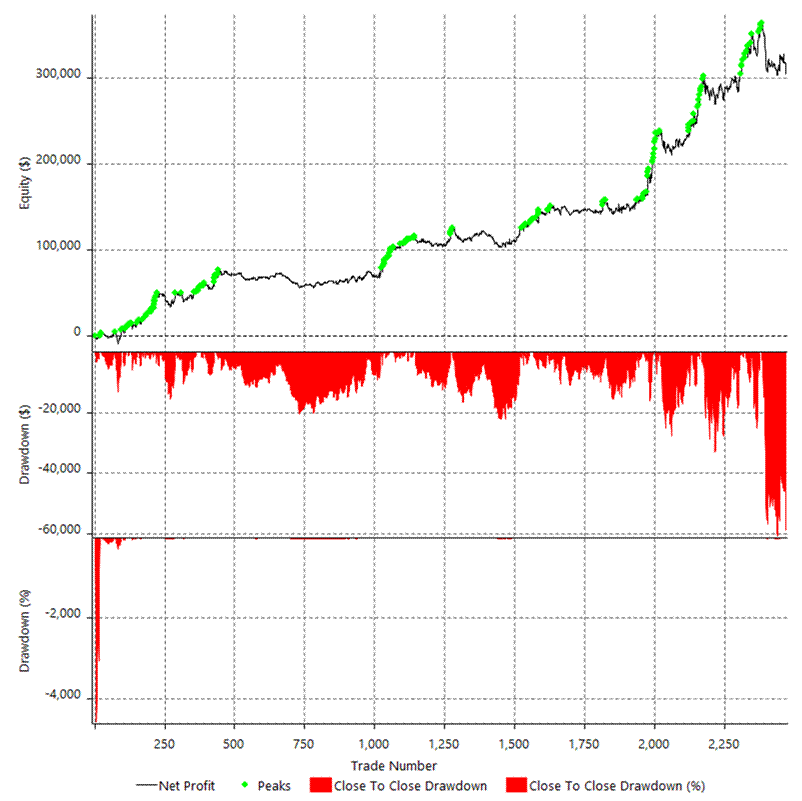
| Equity
Curve Detailed with DrawDown |
|
|
|
|
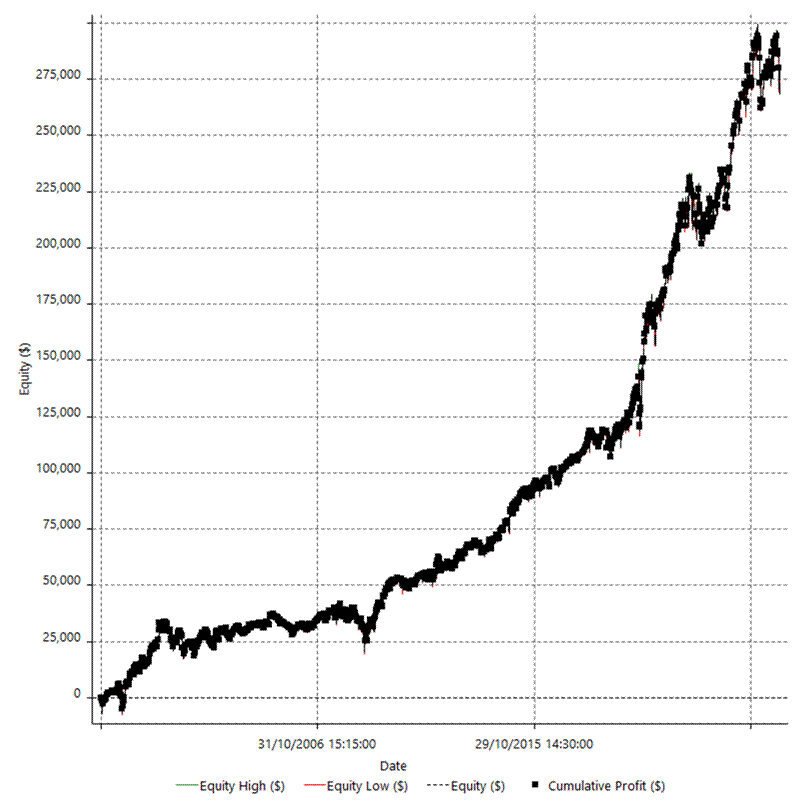
| Equity Curve Detailed Long |
|
|
|
|
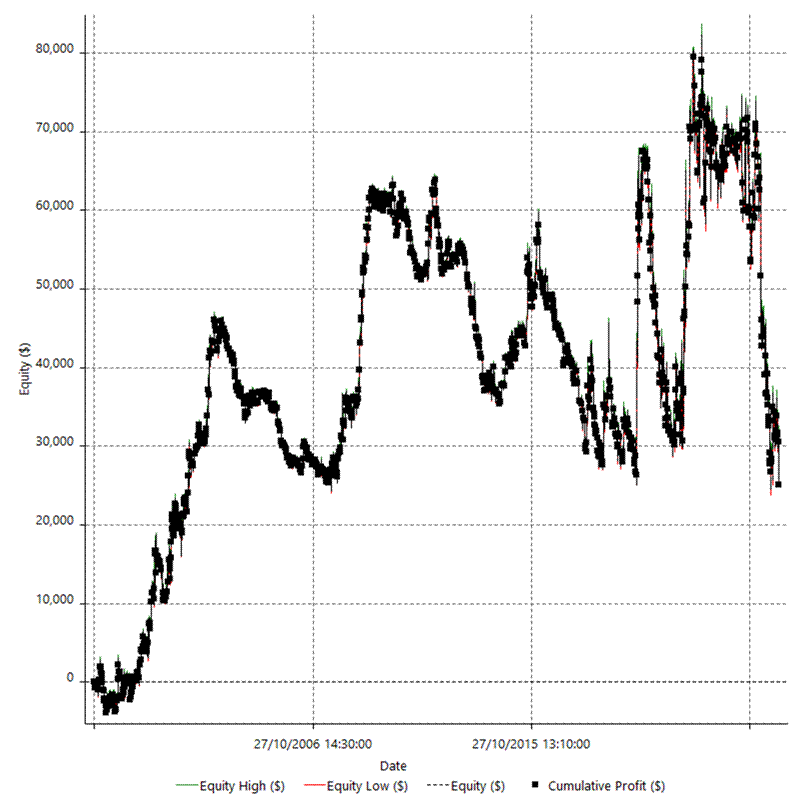
| Equity Curve Detailed Short |
|
|
|
|
|
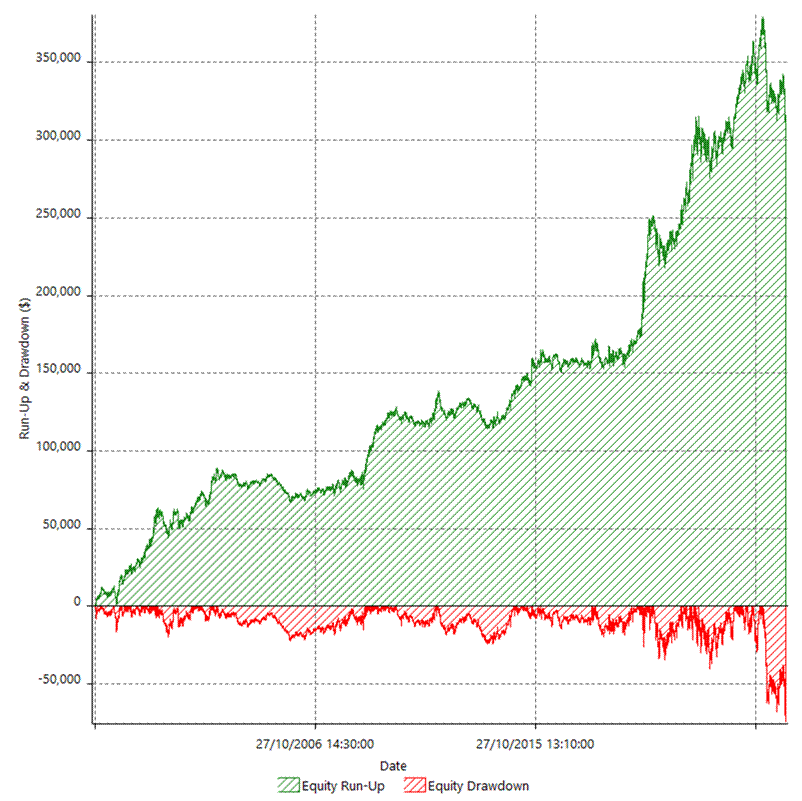
| Equity Run-up & Drawdown |
|
|
|
|
|
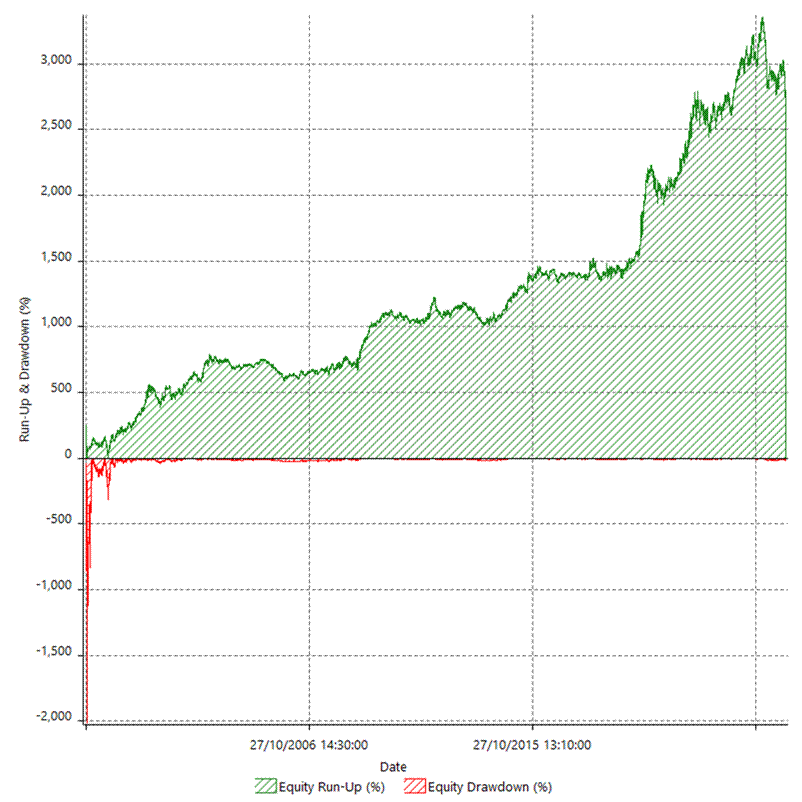
| Equity Run-up & Drawdown
(%) |
|
|
|
|
| Equity Curve Close To Close |
|
|
|
|
| Equity
Curve Close To Close With Drawdown |
|
|
|
|
|
| Buy & Hold Return |
|
|
|
|
|
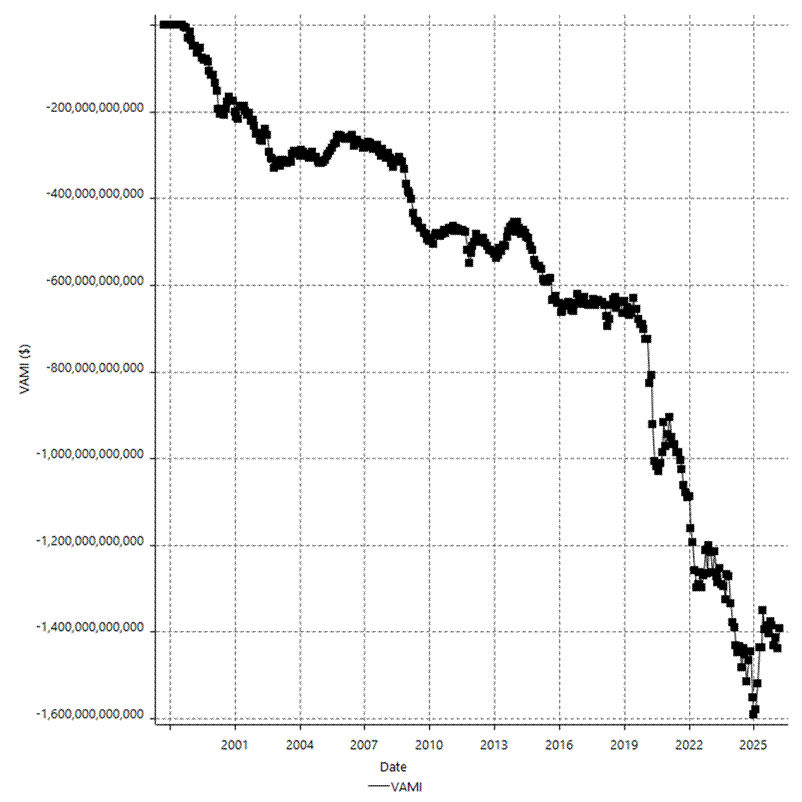
| Value Added Monthly Index |
|
|
|
|
|
|
|
|
|
|